

5 Ways SAP Testing Services Can Optimize Your Business Processes
In today’s technology-driven landscape, businesses are constantly striving to streamline their operations, enhance efficiency, and stay ahead of the competition
Read moreAutomation in IT operations enable agility, resilience, and operational excellence, paving the way for organizations to adapt swiftly to changing environments, deliver superior services, and achieve sustainable success in today's dynamic digital landscape.
Next-generation application management fueled by AIOps is revolutionizing how organizations monitor performance, modernize applications, and manage the entire application lifecycle.
AIOps and analytics foster a culture of continuous improvement by providing organizations with actionable intelligence to optimize workflows, enhance service quality, and align IT operations with business goals.
In today’s fast-paced business environment, enterprises are increasingly adopting digital technologies to drive innovation, enhance decision-making, and streamline their operations. However, with the complexity of modern IT ecosystems and the rapid expansion of data sources, managing the massive volumes of information and ensuring it is leveraged effectively has become a significant challenge. Traditional methods of handling this vast array of unstructured and siloed data often fall short, leading to inefficiencies, bottlenecks, and missed opportunities.
This is where Knowledge Graph (KG) comes into play. The need for knowledge graph arises from the growing demand for a more structured, connected, and intelligent way to manage and analyze enterprise data. In an era of big data, businesses need solutions that not only store data but also understand and connect it in a way that makes it actionable. Knowledge graph offers a powerful way to represent complex relationships between disparate data points, making them invaluable for enterprise application management.
A Knowledge Graph is a powerful data structure that organizes and represents knowledge in a machine-readable format. It provides a framework for understanding and exploring relationships between various data points (or entities) within an IT ecosystem. These entities can be physical or digital assets, such as servers, network devices, applications, users, and services. The relationships between these entities are captured through links, which are called edges (or arcs), creating a graph-like structure. The concept of a knowledge graph is rooted in graph theory, where data points are represented as nodes (vertices), and the connections between them are represented as edges.
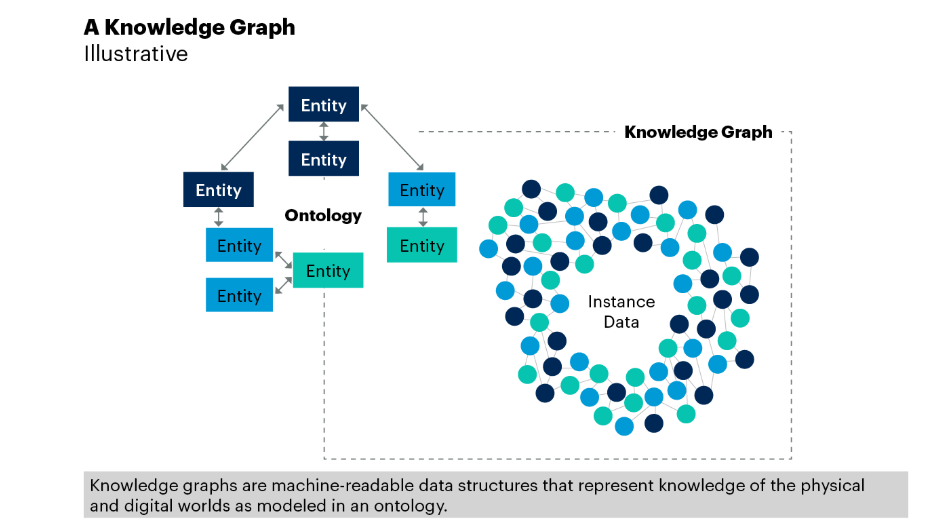
Source: Gartner
Unlike traditional databases that store data in rigid tables, a knowledge graph allows for a more dynamic and flexible representation of information. This enables businesses to integrate data from multiple sources, including structured data (e.g., databases) and unstructured data (e.g., text documents, social media), into a unified framework. It allows systems to understand not just the data itself, but the context and relationships that exist between the data points.
To better understand how enterprise knowledge graphs work, let’s break down its key components:
Nodes represent the core elements or entities within the graph. These could be anything from customers, products, or applications to business units, systems, or even abstract concepts. Each node is a unique entity that carries specific attributes or properties.

While many understand, the importance of software testing is limited to identifying bugs and ensuring quality, there are several lesser-known benefits that are often important and have a critical role in software development. Investing in comprehensive software testing offers numerous benefits:
Edges represent the relationships or connections between entities. For instance, an edge might represent a customer’s interaction with a product, or a link between two applications within an enterprise ecosystem. Relationships can be directed or undirected and can carry specific metadata that describes the type of relationship.
Each node and edge may have properties or attributes associated with them. For example, a customer node might have properties such as age, location, and purchase history, while a relationship between a customer and a product might include properties such as the date of purchase or frequency of use.
The ontology or schema defines the types of entities, relationships, and attributes that can exist within the knowledge graph. It essentially governs the structure of the knowledge graph, providing the rules for how data points are related and ensuring consistency across the graph.
Integrating knowledge graph into enterprise application management offers a range of transformative benefits. Below are some of the most significant advantages:
Knowledge graphs provide a comprehensive view of an organization’s data landscape. By connecting disparate data sources and making relationships between data points more explicit, knowledge graphs enable quicker and more accurate data discovery. This enables decision-makers to uncover valuable insights that would otherwise be hidden in isolated data silos.
In large enterprises, data is often stored in different systems and formats, making it difficult to achieve interoperability. Knowledge graph acts as a bridge, linking data from various sources and systems in a seamless, integrated manner. This interconnected structure makes it easier to access and analyze data, regardless of where it originates or in what format it exists.
With knowledge graph, businesses gain a more contextual understanding of their data. Instead of simply querying isolated datasets, organizations can analyze how different data points are interrelated, leading to more informed decision-making. For instance, in application management, it allows teams to understand how different applications or components are linked, helping them make better decisions about resource allocation, performance optimization, and troubleshooting.
For enterprise IT teams, quickly identifying and resolving issues is critical to maintaining application performance and service availability. Knowledge graph facilitates faster root cause analysis (RCA) by providing a visual map of dependencies and interactions. By tracing the connections between different systems and applications, IT teams can quickly pinpoint the source of problems and resolve them efficiently.
By understanding the relationships between different applications and systems, businesses can automate workflows more effectively. Knowledge graphs enable the automation of tasks based on insights drawn from the relationships between data points. For example, when an issue is detected in one application, the knowledge graph can trigger automatic checks and fixes in related systems, reducing manual intervention and downtime.
Knowledge graphs can improve compliance by enabling organizations to track relationships between data sources and systems. This transparency helps in auditing and monitoring for compliance with regulations. Additionally, the graph can identify potential risks by mapping connections between vulnerable systems, enabling proactive risk management.

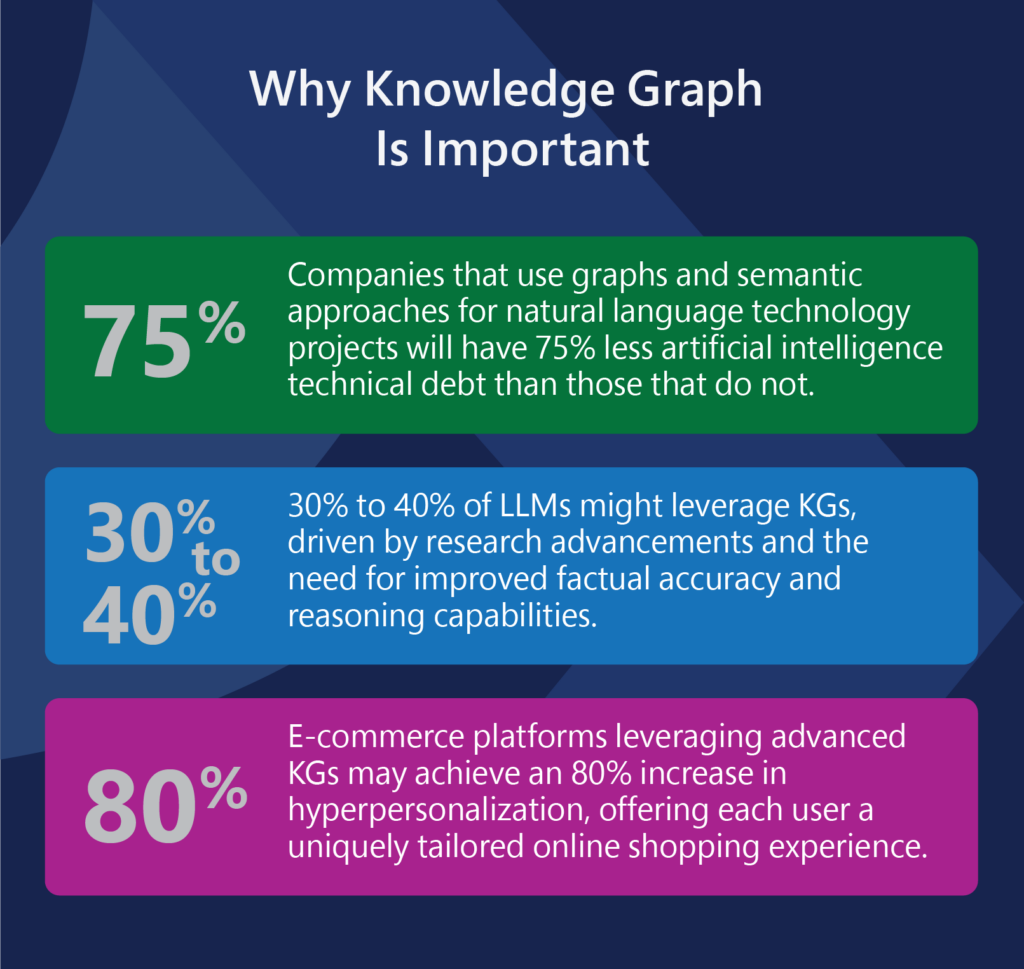
Source: Gartner
In healthcare, knowledge graphs are used to integrate patient records, medical history, diagnoses, treatments, and other clinical data. By linking this data with research articles, clinical trials, and treatment guidelines, healthcare organizations can improve patient care by offering personalized treatment plans, enhancing decision-making, and identifying potential medical errors before they occur. According to Gartner, by 2026, the integration of KGs into healthcare systems could lead to an extraordinary 90% improvement in the speed of drug discovery processes.
In the finance industry, knowledge graphs help with fraud detection and risk management by mapping relationships between transactions, accounts, and individuals. They enable institutions to detect suspicious activities by identifying unusual patterns and connections across various data points. Financial institutions also use knowledge graphs to provide better customer insights, recommend products, and manage regulatory compliance.
E-commerce companies use knowledge graphs to enhance product recommendations, customer segmentation, and supply chain management. By understanding the connections between customers, products, preferences, and purchase behaviors, e-commerce platforms can offer more personalized shopping experiences and optimize inventory management.
Telecom companies use knowledge graphs to manage their complex networks and improve customer service. By mapping out the relationships between network components, devices, and users, telecom companies can optimize network performance, predict outages, and respond to service disruptions faster.
At Qinfinite, we recognize the challenges faced by enterprises in managing complex IT environments. With our Intelligent Application Management (iAM) platform powered by an advanced knowledge graph, we help organizations with a living map of their entire IT universe to streamline their application management processes, boost efficiency, and drive cost savings.
In summary, knowledge graphs are an invaluable tool for enterprise application management. By transforming how data is connected, analyzed, and acted upon, they enable businesses to operate more efficiently, reduce costs, and make better decisions. With Qinfinite’s powerful knowledge graph technology, enterprises can unlock the full potential of their IT ecosystems and stay agile in today’s rapidly evolving market.
A knowledge graph is a structured representation of information that connects data points (entities) with relationships, creating a graph-like network. It captures knowledge in a way that machines can understand, allowing for better search, data discovery, and insights. Knowledge graphs typically consist of nodes (representing entities like people, places, or concepts) and edges (representing relationships between these entities). They are used to model real-world knowledge in a way that machines can navigate, analyze, and infer new connections.
In IT automation, a knowledge graph represents the relationships between various IT components, such as infrastructure, services, applications, and configurations. It links data about systems, network topologies, dependencies, processes, and more, providing a comprehensive and dynamic view of IT environments. By integrating information from multiple sources, a knowledge graph in IT automation helps automate decision-making processes, identify issues, and optimize workflows, enhancing efficiency and reducing manual intervention.
To implement knowledge graphs for IT automation:
– Data Collection: Gather relevant data from various IT systems, such as servers, databases, networking devices, and applications. This can include both structured data (e.g., configuration files) and unstructured data (e.g., logs).
– Data Integration: Integrate disparate data sources to create a unified knowledge graph. This may involve using APIs, ETL processes, or other integration methods to bring together data from different tools and systems.
– Modeling Relationships: Define entities and relationships that are relevant to your IT environment (e.g., applications depend on databases, servers interact with networking components). This step is crucial to ensure the graph represents the real-world structure accurately.
– Automation Rules: Define automation rules based on the relationships in the knowledge graph. These rules could be used for tasks like monitoring, incident response, or predictive maintenance.
– Tools and Platforms: Leverage knowledge graph tools (e.g., Neo4j, TigerGraph) and automation platforms (e.g., ServiceNow, Ansible, or Kubernetes) to visualize and interact with the graph while setting up automation tasks.
– Improved Decision-Making: Knowledge graphs provide a holistic, real-time view of IT systems, enabling better insights and informed decision-making for system administrators and IT teams.
– Enhanced Visibility: They help to visualize and understand complex relationships between systems, applications, and services, improving overall visibility into operations.
– Faster Issue Resolution: By mapping out dependencies and links between IT components, knowledge graphs help to quickly identify the root cause of issues, speeding up incident response.
– Better Change Management: When changes are made to IT systems, knowledge graphs can track potential impacts across the network, ensuring that changes are safer and more efficient.
– Automation of Repetitive Tasks: With the relationships and rules embedded in the graph, knowledge graphs enable the automation of repetitive IT tasks, reducing manual errors and increasing efficiency.
Knowledge graphs enhance IT process automation by providing an intelligent, context-aware foundation for automation systems. Here is how Knowledge Graph helps:
– Contextual Understanding: Knowledge graphs give automation systems a contextual understanding of the relationships between systems, which is crucial for dynamic and complex decision-making.
– Smart Routing and Escalation: By understanding dependencies and prioritizing tasks based on the criticality of affected systems, knowledge graphs help route requests and escalations to the right team or automation process.
– Proactive Automation: They enable predictive automation, where systems can anticipate failures or performance bottlenecks based on historical data and relationships, triggering preventative actions before issues arise.
– Orchestration of Complex Workflows: Knowledge graphs provide a framework for managing multi-step, interconnected automation processes, ensuring the correct sequence and dependencies are followed in IT workflows.
Integrating knowledge graphs into IT workflows involves several steps:
– Data Ingestion: Continuously feed data from various IT management tools (e.g., monitoring systems, asset management tools, service management platforms) into the knowledge graph.
– API Integration: Use APIs to connect the knowledge graph with existing IT systems and workflow automation platforms, ensuring seamless data exchange.
– Trigger Automation: Set up triggers based on the relationships and entities in the knowledge graph, so that changes in the graph automatically trigger workflow actions such as alerts, remediation, or updates.
– Visualization: Use visualization tools to display the knowledge graph, providing IT teams with intuitive, interactive dashboards that allow them to quickly see the state of the system and the relationships.
– Feedback Loops: Establish feedback mechanisms where automated workflows can update the knowledge graph with new insights, helping it evolve in real time and refine the automation processes.
Some key applications of knowledge graphs in IT automation include:
– Incident and Problem Management: Knowledge graphs help identify and resolve incidents by mapping out the relationships between affected systems, pinpointing the root cause, and automating remediation.
– Change Management: By understanding system dependencies, knowledge graphs enable safer and more efficient management of changes to IT infrastructure.
– Service Management: They provide a unified view of services, helping automate service requests, incident resolutions, and self-healing operations in IT environments.
– Predictive Maintenance: Knowledge graphs allow automation systems to predict potential failures by analyzing the relationships and health data of IT components, initiating preventive maintenance before issues arise.
– Security and Compliance: Knowledge graphs help track the relationships between different components and data flows, assisting in identifying vulnerabilities, securing communication, and ensuring compliance with regulations.
– Cloud Management: They help manage cloud environments by automating provisioning, monitoring, and scaling based on the relationships and dependencies mapped in the graph.
In today’s technology-driven landscape, businesses are constantly striving to streamline their operations, enhance efficiency, and stay ahead of the competition
Read moreIn today’s rapidly changing world, enterprises have to improve businesses by keeping up pace with technological advancements and improve operational efficiencies across value chains.
Read moreExplore how AI-driven software testing improves QA with improved test efficiency, accuracy and cost-reduction. Dive into key insights from Forrester report.
Read moreGet in touch with Quinnox Inc to understand how we can accelerate success for you.