facebook

Measuring Success: 7 Key Metrics to Track for Effective Automated Regression Testing

ESG Trends

Accelerate IT operations with AI-driven Automation

Automation in IT operations enable agility, resilience, and operational excellence, paving the way for organizations to adapt swiftly to changing environments, deliver superior services, and achieve sustainable success in today's dynamic digital landscape.

Driving Innovation with Next-gen Application Management

Next-generation application management fueled by AIOps is revolutionizing how organizations monitor performance, modernize applications, and manage the entire application lifecycle.

AI-powered Analytics: Transforming Data into Actionable Insights 

AIOps and analytics foster a culture of continuous improvement by providing organizations with actionable intelligence to optimize workflows, enhance service quality, and align IT operations with business goals.  

Automation in regression testing has become a cornerstone of modern software development, ensuring faster releases and ensuring higher quality. But while the benefits of automated regression testing are undeniable, how do we measure its success? How do you know if your automated tests are catching the right bugs, or if they’re even necessary in the first place?   

Regression testing is vital for ensuring that code changes don’t break existing functionality, but simply automating the process doesn’t guarantee success. To truly optimize your testing efforts, you need to track the right metrics. 

According to recent studies, organizations that implement automated testing see a 40% reduction in testing time and a 30% increase in overall testing coverage. Transitioning from manual to automated regression testing is more than a technical upgrade—it’s about measuring quality at scale and improving efficiency. But with so much data, how do you know what to focus on? 

In this blog, we’ll dive deep into the key metrics that can help you measure the effectiveness of automated regression testing and ensure your software development process delivers high-quality results. 

Why Transitioning from Manual to Automated Regression Testing Is Critical

Before we jump into the specifics of metrics, let’s discuss why moving from manual to automated regression testing is essential in today’s fast-paced development environment. 

  1. Speed and Efficiency: Manual regression testing can be a slow, laborious process. Testers must manually run the same test cases for every code change or release, which becomes time-consuming as projects scale. Automated testing speeds up this process by allowing tests to run without human intervention, ensuring that testing can keep up with rapid development cycles. 
  2. Scalability: As your codebase grows, the number of regression tests increases. Manually handling hundreds or thousands of test cases becomes unmanageable. Automation enables scaling by handling large test suites more efficiently, providing quick feedback on new code changes. 
  3. Consistency: Automated tests ensure that every test is run in the same way, every time, removing human error from the equation. This guarantees consistency in results and helps teams trust the accuracy of their testing efforts. 
  4. Cost-effectiveness: While the initial setup for automated regression testing may require time and resources, the long-term savings are significant. According to a report, organizations that leverage automated testing see a 60% reduction in testing costs over time. 

Key Metrics for Effective Automated Regression Testing

Once you’ve made the leap to automated regression testing, the next step is to ensure that your tests are truly effective. How do you quantify success? Let’s explore the most important metrics you should track. 

Take an in-depth look at how Shift Left Testing can enhance your QA with Open Data Core (ODC) Meta connector and Qyrus. Read Now 

1. Test Coverage

Test coverage measures the percentage of your code that is executed by your automated tests. It answers a fundamental question: “Are we testing everything we need to?” 

High test coverage ensures your tests are comprehensive, meaning they cover most of your codebase. However, it’s important to note that 100% coverage doesn’t always guarantee quality—just because a line of code was executed doesn’t mean it was adequately tested. 

How to measure it: You can track test coverage with tools like Qyrus, which provide reports on how much of your code is being covered by tests. Aim for 80-90% coverage in critical areas, but don’t over-prioritize it to the point of neglecting other quality factors. 

2. Test Execution Time

Test execution time measures how long it takes for your automated test suite to run. This is a crucial factor when evaluating the efficiency of your regression testing process. 

Slow execution times can bottleneck your development pipeline, delaying feedback to developers. According to a GitLab survey, 31% of developers said that slow tests were their biggest testing challenge. Faster execution times enable quicker feedback loops and more frequent deployments. 

How to measure it: Track the total time it takes for your test suite to run and break it down by individual tests. Tools like Jenkins, Bamboo, and CircleCI often provide execution time tracking. 

3. Pass/Fail Rate

The pass/fail rate is a simple metric that tracks how many of your automated tests pass or fail during each run. It’s essential for understanding the health of your codebase over time. 

A high fail rate might indicate issues with the code, but it can also signal problems with the test scripts themselves. Flaky tests—those that fail intermittently for no apparent reason—can skew results and waste development time. 

How to Measure It: Tools like Selenium, TestNG, and JUnit can report on test pass/fail rates, often providing detailed reports on individual test cases. 

Quick Note: A high pass rate is not always indicative of success. If tests are outdated or not testing critical areas, even a 100% pass rate could give a false sense of security. 

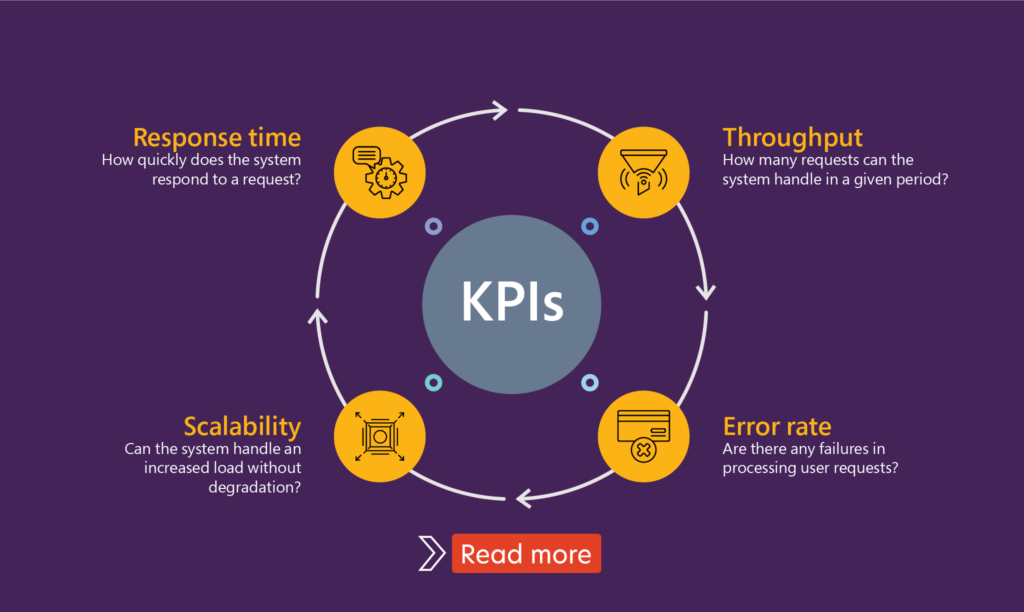
Tailor KPIs to Your Use Case: 

For example, a financial services app might prioritize low response times for transaction processing, while an e-commerce platform might focus on throughput during high traffic sales events. Customize your performance KPIs based on your specific application and business needs. 

Qyrus, for instance, offers real-time tracking of these KPIs, enabling teams to monitor them during test execution and view historical performance trends. This continuous feedback loop allows Agile teams to tweak their systems to ensure they meet business goals. 

4. Defect Detection Effectiveness (DDE)

Defect Detection Effectiveness measures how well your automated regression tests are catching bugs. You want to ensure that your tests identify real defects, not just running without contributing value. This metric calculates the percentage of defects found by automated tests before the software is released to production. 

How to Measure It: DDE is calculated by dividing the number of defects found during automated testing by the total number of defects found (automated + manual + production defects) and multiplying by 100. 

Did you know? According to a report by Forrester, companies using cloud-based testing environments have reduced their testing costs by up to 45% while improving test coverage by 30%.

5. Test Maintenance Effort

This metric tracks the amount of time spent maintaining automated tests, such as updating test scripts to align with code changes or fixing flaky tests. If the time spent maintaining automated tests is too high, it can offset the benefits of automation. The goal is to reduce maintenance to ensure that automated regression testing remains a cost-effective solution. 

How to Measure It: Keep track of the hours or days spent maintaining test scripts. Ideally, you want this to be less than 10% of your overall testing time. 

For Instance, a retail company initially spent 30% of their testing time maintaining test scripts due to frequent UI changes. By investing in a more robust testing framework and designing tests that were less reliant on UI elements, they reduced maintenance time to just 8%. 

6. Flaky Test Rate

A “flaky” test is one that sometimes passes and sometimes fails without any changes to the underlying code. This can severely hinder the reliability of automated regression testing. Flaky tests erode trust in your testing process. They can mask real issues or, worse, introduce false positives that waste developer time. 

How to Measure It: Track the number of tests that exhibit inconsistent behavior over time. Aim for a flaky test rate below 5%. 

7. Return on Investment:

Ultimately, all the above metrics feed into one overarching KPI: ROI. The return on investment from automated regression testing is a combination of time saved, costs reduced, and defects prevented compared to manual testing. 

Measure ROI by comparing the cost of setting up and maintaining automated regression tests to the costs of defects, manual testing efforts, and delayed releases.

Conclusion: Using Metrics to Continuously Improve

Automated regression testing is a powerful tool, but only when you measure the right things. By focusing on these metrics, you can ensure that your tests are delivering real value. In the end, the goal of automation isn’t just to test faster—it’s to test smarter. 

Tracking these metrics will help you optimize your regression testing efforts, leading to higher software quality, faster releases, and a more efficient development process. Remember, continuous improvement is key; these metrics should evolve as your codebase and testing needs grow.  

Tools like Qyrus, with their advanced analytics and intuitive dashboards, make it easier to track these metrics in real time. By leveraging Qyrus, teams can achieve high test coverage, faster execution times, and ultimately, higher software quality—all while keeping test maintenance to a minimum. 

At Quinnox, we’ve seen firsthand the transformative power of Qyrus in helping our clients optimize their automated regression testing efforts. Our tailored solutions combine industry expertise with cutting-edge tools to ensure that your automation strategy delivers measurable results, driving faster releases and reduced costs. 

Are you ready to take your automated regression testing to the next level? Start tracking these metrics today and see the difference! 

Connect with Us Today.

Related Blogs

Want to know more about CX? Read interesting blogs below!

Blogs
Legacy Modernization

The Foundation for Innovation: Why Legacy Modernization is Essential for a Successful AI Strategy 

In today's competitive landscape, organizations are constantly seeking innovative ways to gain a competitive edge. Artificial intelligence (AI) has emerged as a powerful tool for optimization, automation, data-driven decision making and productivity

Read more
Webinar
Webinar

Unlocking Legacy Potential: How Intelligent Twin Power Modernization

Watch on-demand webinar to get insights & strategies from Forrester analyst on how to navigate complexities of modernization

Read more
Solution Article
AMS

Quinnox’s Next-Generation AMS Platform

Application Managed Services (AMS) has been a competitive environment for service providers. With most competing with a cost advantage, providers have been innovative in the benefits that are delivered to their clients.

Read more
Contact Us

Get in touch with Quinnox Inc to understand how we can accelerate success for you.